
Executive summary
Religious institutions in the United States receive a broad package of tax advantages: exemption from federal income tax, common exemption from state and local property taxes, donor deductibility, and special carveouts such as the parsonage allowance.
Many faith communities provide real public value. The problem is that the current exemption regime is largely unconditional and often opaque.
The policy case is structural, not cultural. When the public provides a subsidy at scale, large institutions should meet transparency standards and be able to document community benefit proportional to the tax advantages they receive.
The economic case is also structural. If the annual fiscal impact is on the order of $100B, the opportunity cost is large enough to move national outcomes in workforce capacity, health outcomes, and macroeconomic stabilization.
1) What the “subsidy” actually is
The public cost is not a single line item. It is several policies that reduce public revenue:
- Property tax exemption (local)
- Income and investment income exemptions (federal and sometimes state)
- Charitable deduction for donors
- Clergy housing carveouts such as the parsonage allowance
The original TRM archive package used an estimate of roughly $71B annually and broke it into major components (property tax exemption, investment income exemption, charitable deduction, and parsonage allowance). Use that breakdown as a baseline reference point. The governance implication matters more than the exact figure: the magnitude is large enough that the exemption should come with conditions and reporting standards.
Visual: what the $100B “bundle” likely contains (illustrative)
This chart is intentionally labeled illustrative. It is a way to keep the debate honest about the fact that the fiscal impact is not one policy.
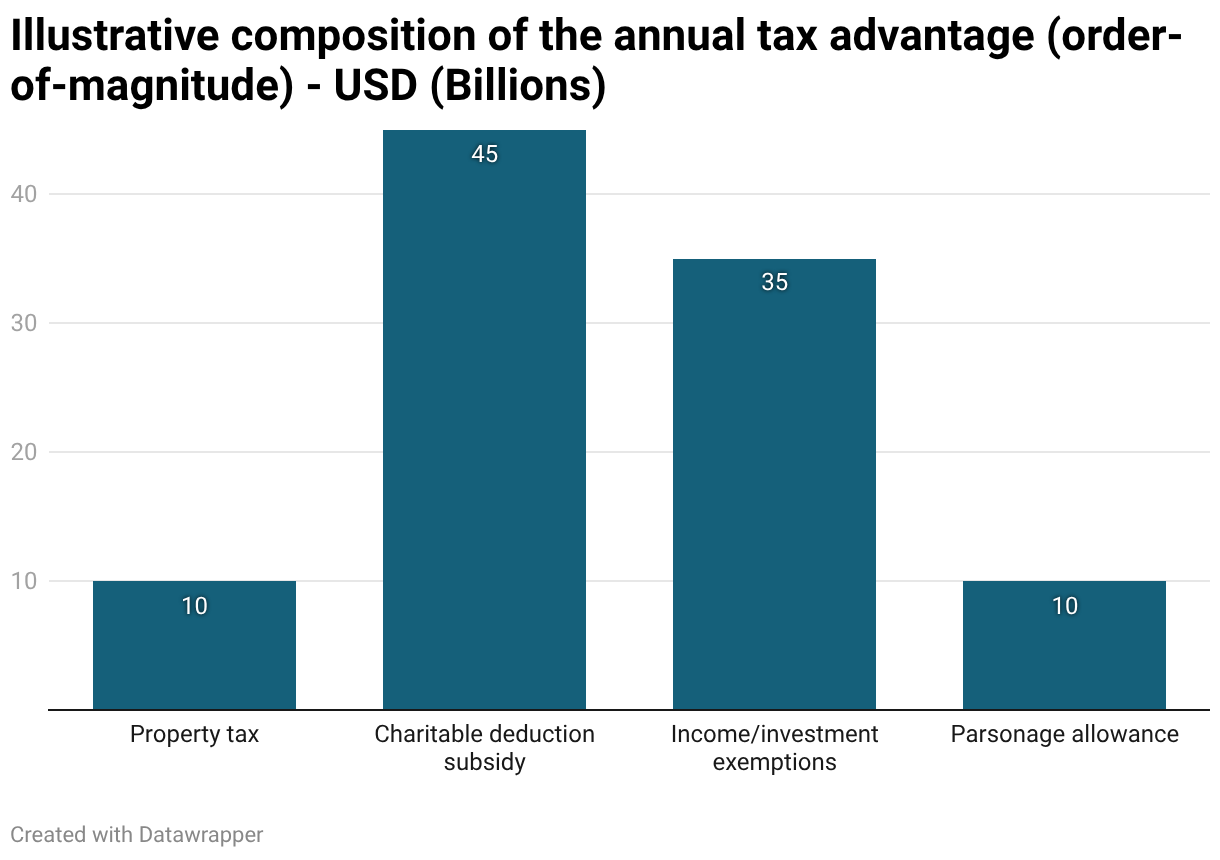
Interpretation:
- The exact mix is uncertain because disclosure is uneven and different components sit in different jurisdictions.
- The point is structural: even if you debate each bar, the combined order-of-magnitude remains large enough to justify conditions and reporting standards.
2) The governance gap is still the central issue
In most nonprofit categories, tax exemption is paired with transparency expectations. Churches are often treated differently.
Two structural features matter:
- Many churches are not required to file the same annual public financial disclosures that comparable nonprofits do.
- Oversight is constrained, and enforcement is rare and politically sensitive.
This is not an argument that “religion is bad.” It is an argument that if an organization receives public subsidy, it should meet a public standard. “Trust us” is not a standard.
2A) Why oversight is not theoretical: cited abuse vectors
The case for tiered reporting and stronger governance is not that religious institutions are uniquely criminal. It is that trust-based, low-disclosure environments are easier to abuse, and the harms can be large when they occur.
Financial abuse and fraud (case-style anchors):
- DOJ has prosecuted and charged fraud schemes involving church leadership. Example: in 2025, the U.S. Attorney’s Office for the Southern District of Georgia announced indictments tied to the House of Prayer Christian Churches of America for alleged fraud schemes and tax charges.[https://www.justice.gov/usao-sdga/pr/eight-members-house-prayer-christian-churches-indicted-fraud-schemes-operation-false]
- Survey evidence also suggests internal financial theft is not rare in church settings. Lifeway Research reports 9% of pastors said their church had experienced embezzlement.[https://research.lifeway.com/2017/08/03/1-in-10-churches-have-had-funds-stolen/]
Abuse in high-trust, youth-serving contexts (why independent safeguards matter):
- The John Jay College “Nature and Scope” report (covering 1950–2002) demonstrates how severe harm can persist over long periods when reporting, independent investigation, and institutional accountability fail.[https://www.usccb.org/sites/default/files/issues-and-action/child-and-youth-protection/upload/The-Nature-and-Scope-of-Sexual-Abuse-of-Minors-by-Catholic-Priests-and-Deacons-in-the-United-States-1950-2002.pdf]
Governance principle (sector-wide but directly relevant):
- GAO has emphasized that governance, transparency, and oversight are critical for maintaining public trust in the tax-exempt sector.[https://www.govinfo.gov/content/pkg/GAOREPORTS-GAO-05-561T/html/GAOREPORTS-GAO-05-561T.htm]
Practical translation:
- The policy goal is not blanket suspicion. It is risk management proportional to subsidy scale: audited financials above thresholds, basic internal-control standards, safeguarding requirements for youth programming, and clear disclosure of related-party transactions and executive compensation.
3) Wealth and compensation are not the only problem, but they are the clearest signal
The 2017 post used examples of high-profile leaders with large personal wealth or high compensation. The intent was not envy. It was to highlight how a tax exemption designed to protect worship and community services can become a shield for high-compensation, high-asset institutions.
Modern media economics makes this easier:
- Attention scales nationally.
- Donations and product sales can scale with the audience.
- Real estate holdings can grow significantly.
If the exemption is intended to protect worship and community service, it should not function as a subsidy for institutions that operate in practice like a hybrid of media business, real estate portfolio, and political advocacy network.
4) The Johnson Amendment problem has changed shape
The 2017 concern was “repeal.” The more realistic risk now is selective non-enforcement or incremental reinterpretation that normalizes candidate endorsements inside religious services.
This matters because it blurs a boundary that keeps the exemption defensible:
- The public subsidizes religious practice.
- The public does not subsidize partisan electioneering.
If that line collapses in practice, the case for no-strings tax exemption gets weaker.
5) A more durable standard: tax benefits should be earned through measurable community benefit
The cleanest reform frame is conditional rather than punitive.
If society subsidizes religious institutions through the tax code, large institutions should demonstrate tangible public benefit commensurate with that subsidy, using criteria that do not require judging theology.
A practical standard can include:
- Documented local services (food assistance, shelter partnerships, addiction recovery support, childcare support, refugee resettlement support, counseling referrals, job placement).
- Financial reporting proportional to size.
- Guardrails against private inurement and self-dealing.
- Separation of worship activity from commercial activity.
6) Cost vs. benefit analysis: what the public gives vs. what the public gets
A tax exemption is not just an absence of taxation. It is an affirmative policy choice that shifts costs onto everyone else.
The key questions are:
- What is the estimated public value of the tax advantages received by an institution and its senior leaders?
- What is the estimated public value of the verifiable services delivered to the community and members?
Because many churches do not provide standardized public filings, comparisons should be explicit about uncertainty. The correct response to uncertainty is not “assume the best.” It is to require reporting proportional to the subsidy.
6A) Tangible numbers (selected, auditable anchors)
1) Lobbying by religious organizations (federal)
OpenSecrets tracks lobbying reported under the “Clergy & Religious Organizations” sector.
- 2024 total reported lobbying spend: $5,140,000
- 2024 number of clients reporting: 18
- 2024 number of lobbyists: 58
- Largest single client in the sector (2024): Friends Committee on National Legislation, $4,000,000
Source: OpenSecrets sector summary (2024): https://www.opensecrets.org/industries/lobbying?cycle=2024&ind=W05
2) Political campaign intervention: what the law says, and what “exceptions” risk doing
The IRS’s baseline rule is clear: 501(c)(3) organizations, including churches, are prohibited from participating or intervening in political campaigns on behalf of (or in opposition to) candidates.
Source: IRS overview page (updated Dec 5, 2025): https://www.irs.gov/newsroom/charities-churches-and-politics
Recent risk vector:
- A 2025 IRS court filing in National Religious Broadcasters v. Werfel argued for a narrower interpretation in which certain internal communications during religious services would not count as campaign intervention.
Source (reporting + discussion): NPR (July 8, 2025): https://www.npr.org/2025/07/08/nx-s1-5460886/irs-now-says-pastors-can-endorse-political-candidates
Source (court document): https://storage.courtlistener.com/recap/gov.uscourts.txed.232590/gov.uscourts.txed.232590.35.0.pdf
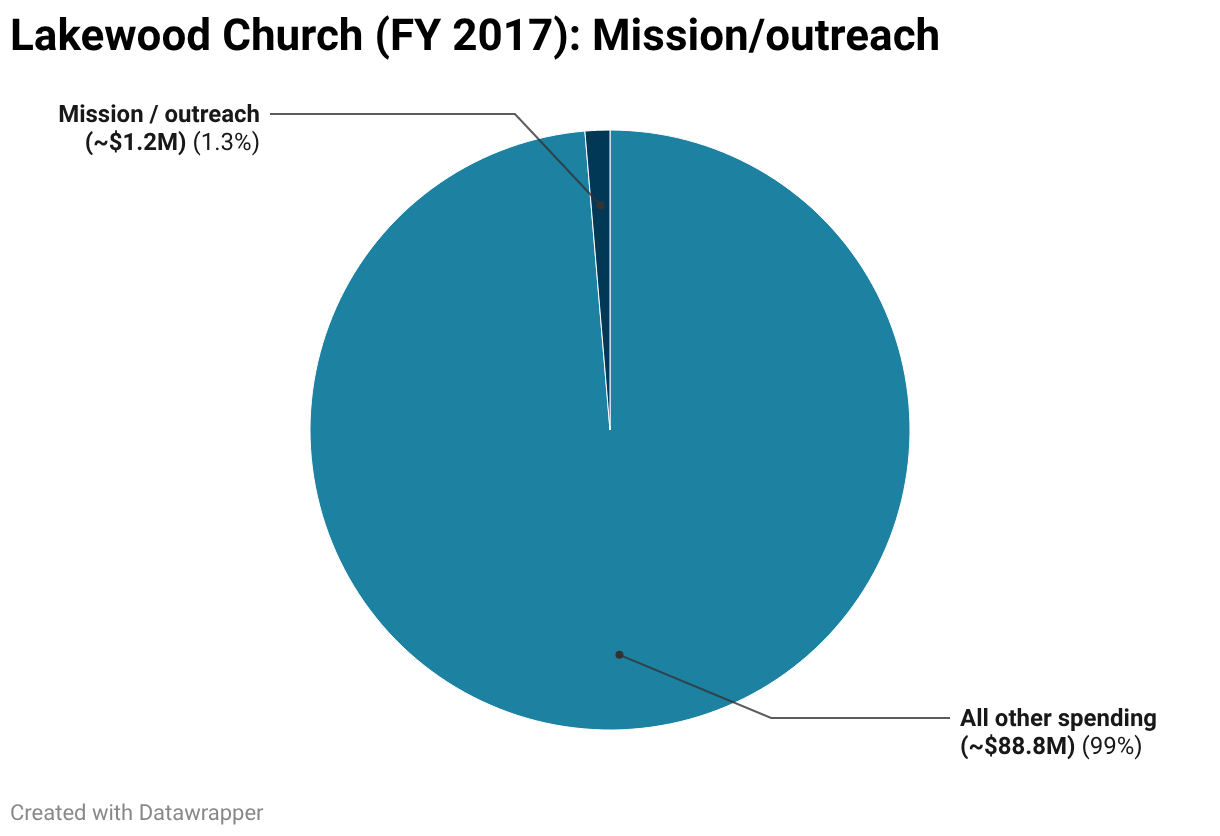
3) Case-style numeric anchor: Lakewood Church budget allocation
- Total spending (FY ended 3/31/2017): ~$90.0M
- Mission/outreach in that breakdown: ~$1.2M
- Mission/outreach share: ~1.3%
Source: Houston Chronicle reporting (2018): https://www.chron.com/news/investigations/article/How-does-Lakewood-Church-spend-its-millions-We-12955372.php
6B) Embedded visuals (original, reproducible)
Chart 0: Year-over-year lobbying totals (OpenSecrets, Clergy & Religious Organizations)
Known points captured in this draft:
- 2017: $5.55M
- 2018: $4.935M
- 2020: $4.871665M
- 2024: $5.14M
Note:
- OpenSecrets publishes annual totals for each year. Some years are not yet captured in this draft because certain pages timed out during retrieval. If you want a fully continuous series, the cleanest approach is to export the OpenSecrets CSV for 2017–2024 and re-render this chart.
Sources:
- 2017 total: https://www.opensecrets.org/federal-lobbying/industries/summary?cycle=2017&id=W05
- 2018 total: https://www.opensecrets.org/federal-lobbying/industries/summary?cycle=2018&id=W05
- 2020 total: https://www.opensecrets.org/federal-lobbying/industries/summary?cycle=2020&id=W05
- 2024 total: https://www.opensecrets.org/industries/lobbying?cycle=2024&ind=W05
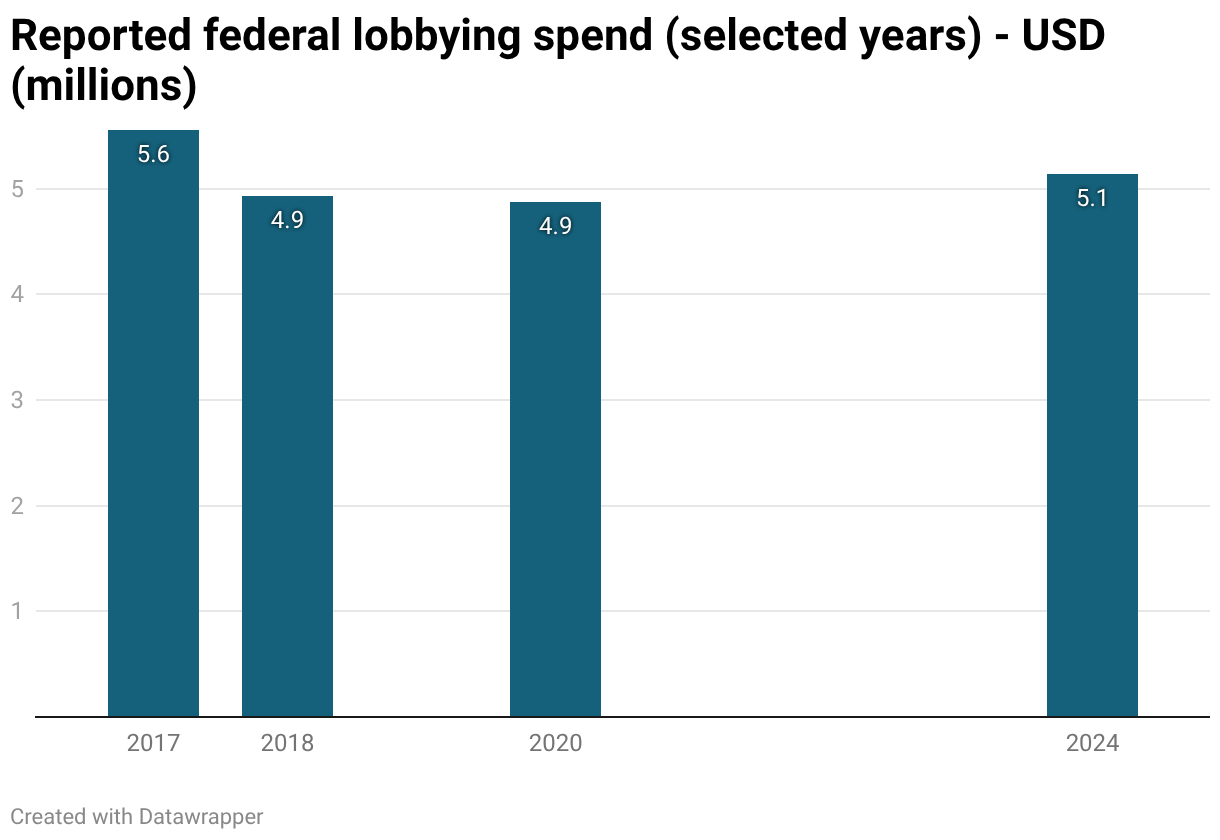
Interpretation (what this does and does not prove)
- It shows religious organizations are persistent participants in federal lobbying.
- It does not prove illegal political activity.
- It does strengthen the broader point: these are not purely private, apolitical institutions. They operate in the same incentive environment as other large organized interests.
Chart 1: Lobbying spend (Clergy & Religious Organizations sector, 2024)
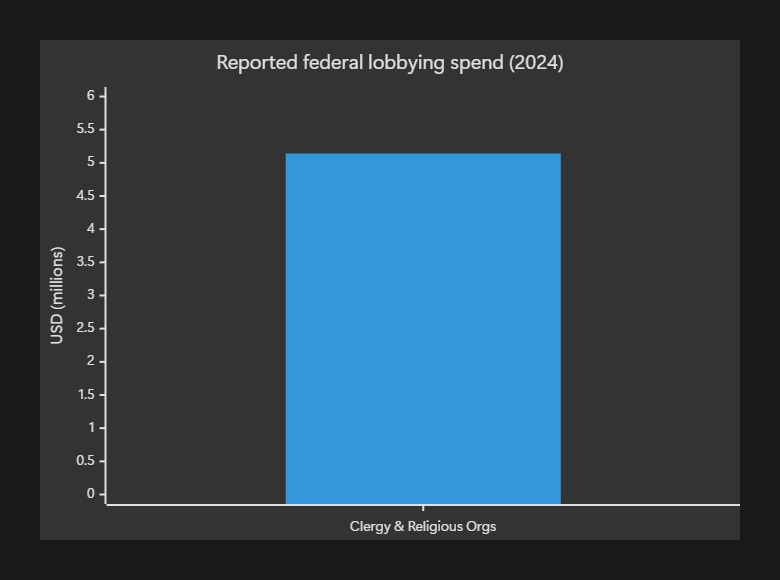
Chart 2: Lakewood budget allocation (FY ended 3/31/2017)
6C) A simple scoring frame (for any large institution)
When the public is asked to accept tax exemption at scale, the institution should be able to produce a clean ledger.
Subsidy side (estimated):
- Property tax exemption
- Value of the charitable deduction to donors (foregone tax revenue)
- Income and investment income exemptions
- Clergy housing allowances where applicable
Benefit side (verifiable):
- Direct community benefit spending
- Outputs (meals, beds, cash aid, placements)
- Independent audit and governance controls
If the benefit side cannot be produced with auditable numbers, the exemption is functionally a trust-based subsidy.
6D) What the public gets today (and how to measure it)
Many religious institutions provide real public value. The problem is not that the benefit is always zero. The problem is that the benefit is not consistently measured, and the subsidy is rarely conditioned on measured benefit.
1) The main public-benefit channels
Direct services (most measurable):
- Food assistance (meals served, pantry boxes distributed)
- Shelter and housing stabilization (bed-nights, placements)
- Utility and rent assistance (households helped, dollars distributed)
- Childcare and youth programming (child-hours, slots, attendance)
- Addiction recovery support (program participation, completion, referrals)
- Disaster response (meals, supplies, volunteer hours)
Social capital and stabilization (real, harder to monetize):
- Community volunteering and civic coordination
- Informal job matching and mentoring
- Family stabilization and counseling referrals
2) A practical “Public Benefit Ledger” (auditable without judging theology)
Large institutions can make the exemption defensible by publishing a short annual ledger that lets communities weigh benefits against the value of tax exemptions.
Subsidy side (estimated, by jurisdiction):
- Property tax exemption value (assessed value × effective local rate)
- Sales tax exemptions where applicable
- Any material exemptions tied to compensation (for example, housing allowances)
Benefit side (verifiable):
- Community benefit spending (cash aid, program spending, grants to local partners)
- Outputs (meals, bed-nights, childcare slots, counseling referrals, job placements)
- Volunteer hours (reported separately from paid labor)
3) The core ratio to keep the debate honest
- Benefit-to-subsidy ratio: estimated tax advantage value ÷ verifiable community benefit value.
If the ratio is favorable and verified, the exemption looks like a purchase of public benefit. If the ratio cannot be calculated because the data does not exist, the exemption is functionally a trust-based subsidy.
7) Estimated current financial impact (and why the number is inherently uncertain)
There is no single official “churches tax subsidy” figure because the policies span multiple levels of government and because churches have atypical disclosure rules. The best way to stay honest is to be explicit about what we can measure, what we cannot, and how we estimate.
A reasonable present-day headline estimate (order-of-magnitude)
The most-cited composite estimate in public debate is a ~$71B per year figure originally published in 2012 and discussed in a later synthesis.[https://theconversation.com/amid-calls-to-taxthechurches-what-and-how-much-do-us-religious-organizations-not-pay-the-taxman-164988]
To translate that “$71B in 2012 dollars” into a 2026-era figure, you can inflation-adjust it. Using a simple CPI-style adjustment (directionally correct, not precise), $71B in 2012 dollars is on the order of $95B to $110B per year in 2026 dollars.
Working number for this draft: $100B per year (2026 dollars).
A measurable anchor: property-tax exemption (state/local)
A separate, more concrete data point from the same synthesis uses a county-level property-tax approach and scales it nationally, yielding ~$6.9B per year in forgone property tax revenue (in 2021-era terms). This should be treated as a rough estimate, but it is useful because it is grounded in actual local tax base math.[https://theconversation.com/amid-calls-to-taxthechurches-what-and-how-much-do-us-religious-organizations-not-pay-the-taxman-164988]
What sits inside the “$100B” framing
Conceptually, the annual fiscal impact combines several channels:
- Property tax exemption (local)
- Donor-side subsidy through charitable contribution deductions (federal, plus state conformity)
- Federal and state income-tax exemptions on certain organizational income and investment income
- Parsonage/housing-allowance exclusion for clergy compensation
Because the data is not centrally reported, a composite estimate must be treated as a “best available” range rather than a point value.
7A) Opportunity cost (recipient-years + “years at current footprint,” using the ~$100B/year working number)
This section keeps two complementary measures:
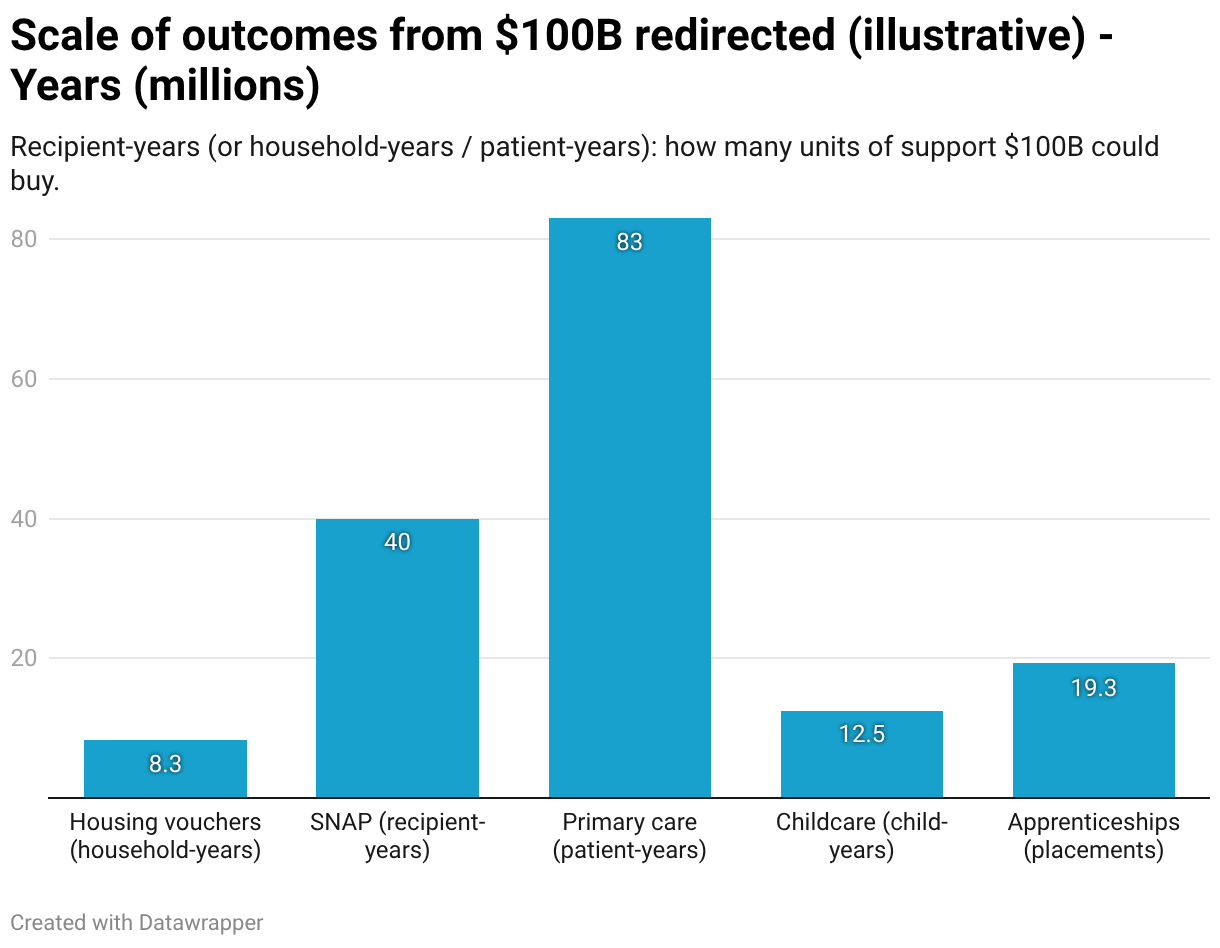
- Recipient-years (or household-years / patient-years): how many units of support $100B could buy.
- Years at current footprint: how long $100B would fund the current annual scale of a program.
These are not forecasts. They are scale comparisons.
Visual: what $100B buys (recipient-years)
Units differ by program, so the goal here is scale, not perfect comparability.
Visual: how long $100B funds each program at current usage
This chart uses the best available, auditable “current footprint” counts and annual spending where we have them. Where we do not yet have a clean annual spending number, the chart is marked as “TBD” in the notes.
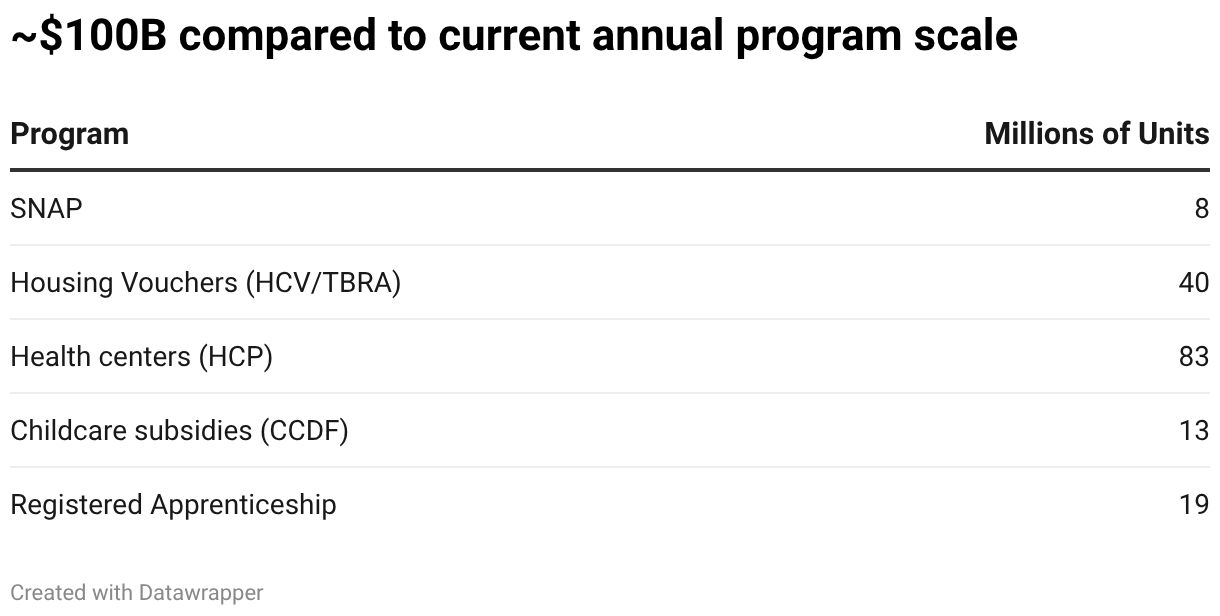
Notes on the bars:
- SNAP: ~1.00 year ($100B ÷ FY2024 SNAP spend $99.8B).[1]
- Housing vouchers (HCV/TBRA): ~2.96 years ($100B ÷ $33.782B TBRA net outlays, FY2024 President’s Budget table).[2]
- Health centers (Health Center Program): ~19.92 years ($100B ÷ $5.019B Health Center Program funding shown on HRSA FY2024 fact sheet).[3]
- Childcare subsidies (CCDF): “TBD” because “children served” and total expenditures are not both consistently available at a single, recent FY in a single source (we update this with ACF-801/ACF-696 once we select the year).
- Registered Apprenticeship: “TBD” because participant totals are available (see GAO), but an all-in annual federal cost number is not cleanly comparable to participants (many costs are borne by employers and states).
Reading note:
- The point is not that these programs are interchangeable. The point is that $100B/year is large enough that, at today’s footprint, it could fund very large slices of the safety net for meaningful spans of time.
1) Housing stability: Housing Choice Vouchers (rental assistance)
Scale (what $100B could buy):
- If you assume an all-in annual public cost of $12,000 per household voucher (ballpark), then $100B could fund on the order of ~8.3 million household-years of vouchers.
Economic impact (what it tends to do in the real world):
- The primary economic return is not a clean GDP multiplier. It is stability.
- Stable housing reduces churn, school disruptions, and crisis-service use. That translates into fewer expensive downstream interventions (shelters, emergency services, foster placements) and better long-run labor-market attachment.
- Caveat to keep it honest: voucher design can create work-disincentive effects at the margin because benefits phase out with income.
2) Food security: SNAP benefit expansion
Scale (what $100B could buy):
- If you assume an average annual benefit of $2,500 per recipient-year (ballpark), then $100B could fund ~40 million recipient-years of additional benefits.
Economic impact (what it tends to do in the real world):
- USDA ERS research has estimated a GDP multiplier of ~1.54 for SNAP benefits during a slowing economy. That is ~$1.54 in GDP for each $1 in additional benefits.[http://www.ers.usda.gov/topics/food-nutrition-assistance/supplemental-nutrition-assistance-program-snap/key-statistics-and-research]
- Translating that multiplier mechanically: $100B in SNAP-like benefits, under relevant macro conditions, implies ~$154B in GDP impact (order-of-magnitude).
3) Primary care access: community health centers (FQHC-style care)
Scale (what $100B could buy):
- Health centers served over 32 million patients in 2024.[https://www.kff.org/medicaid/community-health-center-patients-financing-and-services/]
- Using a conservative $1,200 per patient-year benchmark for primary-care capacity, $100B could support ~83 million patient-years of basic primary-care access.
Economic impact (how improved health outcomes help society and the economy):
Improved health outcomes are not just a moral win. They are an economic input that raises national capacity. The returns show up through multiple channels:
- Avoided expensive care and slower cost growth.
- Better primary care can reduce use of secondary care and reduce overall health costs.[https://www.who.int/docs/default-source/primary-health-care-conference/phc—economic-case.pdf]
- This is the cleanest near-term “budget” mechanism. Fewer preventable emergencies and avoidable hospitalizations reduce the most expensive forms of care.
- Higher workforce participation and productivity.
- Health is human capital. Better-managed chronic conditions mean fewer missed workdays, fewer disability exits, and more stable labor-market attachment.
- Employers capture part of the value through lower absenteeism and less presenteeism. Households capture part of the value through steadier earnings and fewer medical crises.
- Reduced poverty pressure and household financial stability.
- Preventable health shocks are a major driver of financial instability. When primary care prevents late-stage complications, families face fewer catastrophic bills and fewer forced tradeoffs (rent vs. medicine, work vs. caregiving).
- Stronger educational and child-development conditions.
- Healthier kids miss fewer school days. Healthier caregivers have more stable work capacity. Those effects compound in long-run human capital.
- Greater resilience during shocks.
- A population with better baseline health and better access to front-door care is more resilient during outbreaks and community disruptions.
Framing note:
It is usually most accurate to describe this as cost offsets + productivity gains rather than a single ROI number, because the benefits are real but distributed across payers, employers, and households.
4) Childcare affordability: subsidy per child-year
Scale (what $100B could buy):
- If you assume a subsidy of $8,000 per child-year (ballpark), $100B could fund ~12.5 million child-years of assistance.
Economic impact (short-run and long-run):
Childcare assistance is unusually powerful because it targets two binding constraints at once: parental labor supply now and child development that shapes lifetime outcomes.
- Near-term economic mechanism: labor supply and job stability.
- When childcare becomes more affordable and reliable, parents can enter the labor force, increase hours, and reduce job churn.
- This is a direct economic capacity gain. It shows up as higher household earnings, higher tax receipts, and lower reliance on safety-net supports.
- Long-run human-capital mechanism: lifetime outcomes for children.
- High-quality early childhood programs can generate long-term gains in education, earnings, health, and reduced crime. The White House Council of Economic Advisers summarizes that early education programs are generally good investments, with benefits that accrue over time through increased earnings and employment, improved health, reduced anti-poverty spending, and reduced crime.[https://obamawhitehouse.archives.gov/sites/default/files/docs/early_childhood_report_update_final_non-embargo.pdf]
- One widely cited anchor: analyses of high-quality programs (for example, Perry Preschool) estimate annual social rates of return in the 7% to 10% range, reflecting gains that compound over the life course.[https://pmc.ncbi.nlm.nih.gov/articles/PMC3145373/]
- Social cohesion and intergenerational effects.
- When childcare access reduces financial stress and instability, it improves family functioning and the stability of children’s environments.
- The long-run effect is fewer downstream interventions in remedial education, health, and the criminal justice system. Those savings are diffuse, but they are exactly the “silent budget” that determines whether societies stay cohesive under strain.
Framing note for this article:
Not every childcare subsidy design automatically produces the high-end early-childhood ROI. The strongest long-run returns are associated with quality and with reaching children and families who are most constrained. But the long-run logic is structurally sound: when you expand reliable childcare, you are buying more work capacity today and more human capital tomorrow.
5) Workforce mobility: Registered Apprenticeship expansion
Scale (what $100B could buy):
- A U.S. Department of Labor evaluation brief finds an average grant cost of ~$5,171 per apprentice (grant-funded portion, not total employer cost).[https://www.dol.gov/sites/dolgov/files/ETA/publications/ETAOP2022-42_AAI_Brief-Costs-Grantees_Final_508_9-2022.pdf]
- At that rate, $100B could support ~19.3 million apprenticeship placements (grant-funded portion).
Economic impact (what it tends to do in the real world):
- A U.S. Department of Labor ROI study found the typical employer experiences a positive return, with a median ROI of ~44.3% when direct and indirect benefits are counted over the analysis period.[https://www.dol.gov/sites/dolgov/files/ETA/publications/ETAOP2022-36_AAI_ROI_Final_Report_508_9-2022.pdf]
- That is not a guarantee at scale, but it is unusually concrete evidence that apprenticeship investment can produce real productivity payback, not just redistribution.
Bottom-line summary: how $100B/year in forgone revenue hurts national capacity
If the annual fiscal impact is on the order of $100B, the opportunity cost is not abstract.
- It is the difference between consumption support that stabilizes GDP (SNAP’s multiplier effect) and leaving that stabilizer on the table.
- It is the difference between workforce-building investments (childcare and apprenticeships) and slower labor-force growth, weaker productivity, and fewer skills pipelines.
- It is the difference between preventive health capacity and higher downstream spending on avoidable acute care.
- It is the difference between housing stability and a larger, more expensive churn-and-crisis system.
In practical terms: $100B per year is large enough to move national outcomes. If it is delivered as a no-strings subsidy without transparency and measurable community benefit, the country pays twice: once in foregone revenue, and again in delayed or underfunded investments that raise growth, stability, and resilience.
7B) 20-year impact estimate (2006–2025) and chart
We do not have an official, audited year-by-year series for the full “religious tax exemption” package.
So the chart below is an estimated series built from:
- A 2012 baseline: $71B/year (2012 dollars) as a composite estimate.
- An inflation-based deflator to express values in nominal dollars for each year.
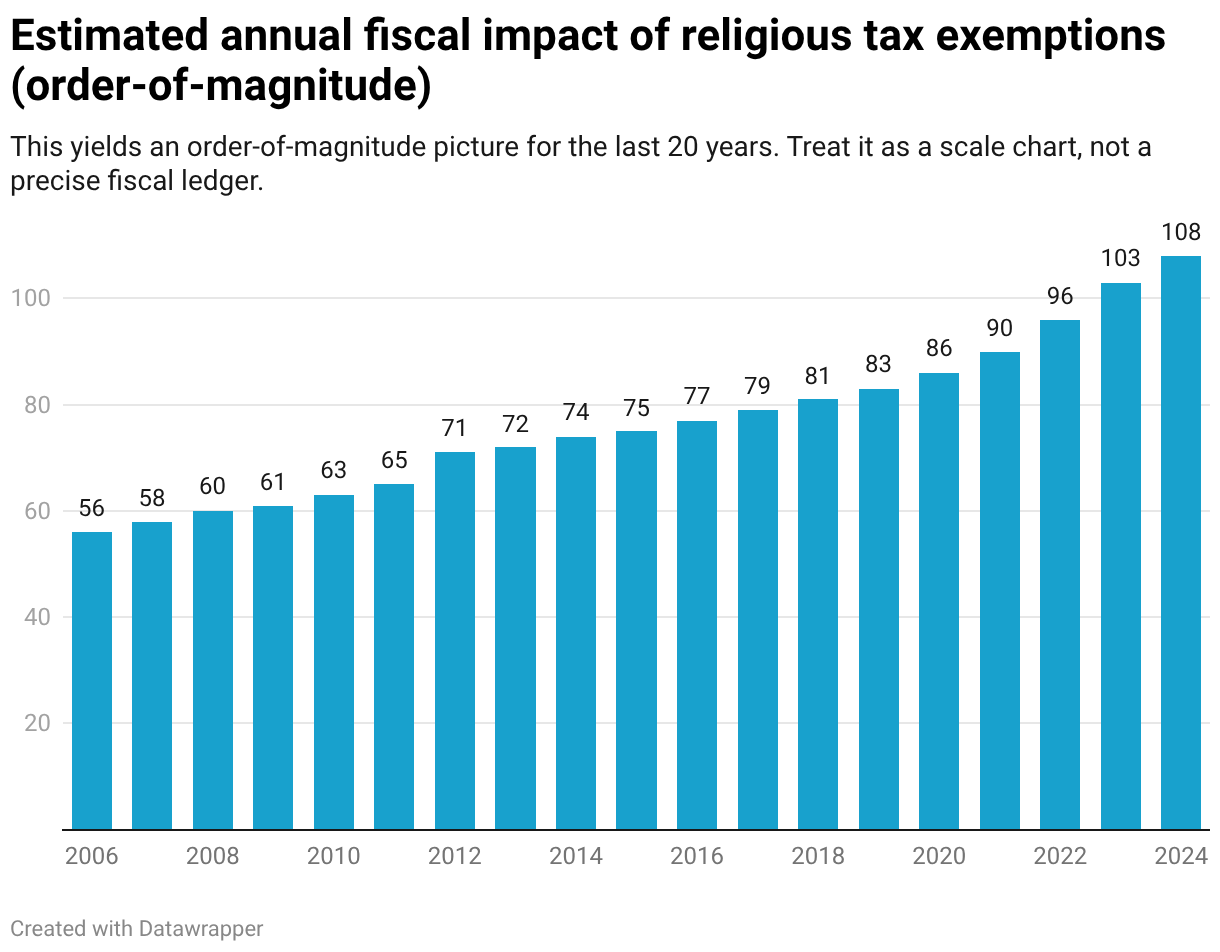
Notes:
- The curve is intentionally smooth because it is inflation-driven. It does not capture policy changes (for example, changes in itemization rates, SALT caps, or donor behavior) that would move the charitable-deduction component up or down.
- If you want a true policy-sensitive series, the best next step is to build a component model: property-tax exemption (state/local) + charitable-deduction tax expenditure (federal JCT/Treasury series) + parsonage allowance (JCT/Treasury series if available) + nonprofit investment-income exemption (partial).
7C) Who benefits by faith/denomination?
Can we measure “tax benefit by belief” directly?
Not cleanly.
The largest parts of the exemption bundle (especially property-tax exemption and donor deductibility) are not reported in a way that lets you credibly allocate dollars by denomination nationwide.
- Property taxes are local, and property-tax exemptions are administered locally. There is no unified national ledger of exempt religious property values by denomination.
- Churches also have atypical disclosure rules relative to other nonprofits, so even at the institution level you often cannot observe a consistent financial base (assets, assessed value, investment income, donation base) across faith groups.
So any chart that claims “Catholics get X dollars, Baptists get Y dollars” without a dedicated, named dataset is usually speculation.
What we can do instead (honest, defensible proxies)
If the purpose is to show “who is most likely receiving the most benefit,” the most defensible approach is to use proxies and label them as proxies.
Proxy options (from strongest to weakest):
- Religious property footprint proxy (best conceptually): estimate exempt property value by denomination using a congregation census / property dataset (if we can access one) and apply local effective tax rates.
- Giving/charitable-deduction proxy: allocate the donor-deduction subsidy using survey data on giving patterns by religion (if we can find a credible, recent source that is explicit about method).
- Adherent-share proxy (weakest but simple): assume the “bundle” roughly scales with the size of each religious tradition (adherents). This ignores large differences in wealth, urban property values, building size, and giving intensity.
Visual (proxy): “who benefits” using adherent-share
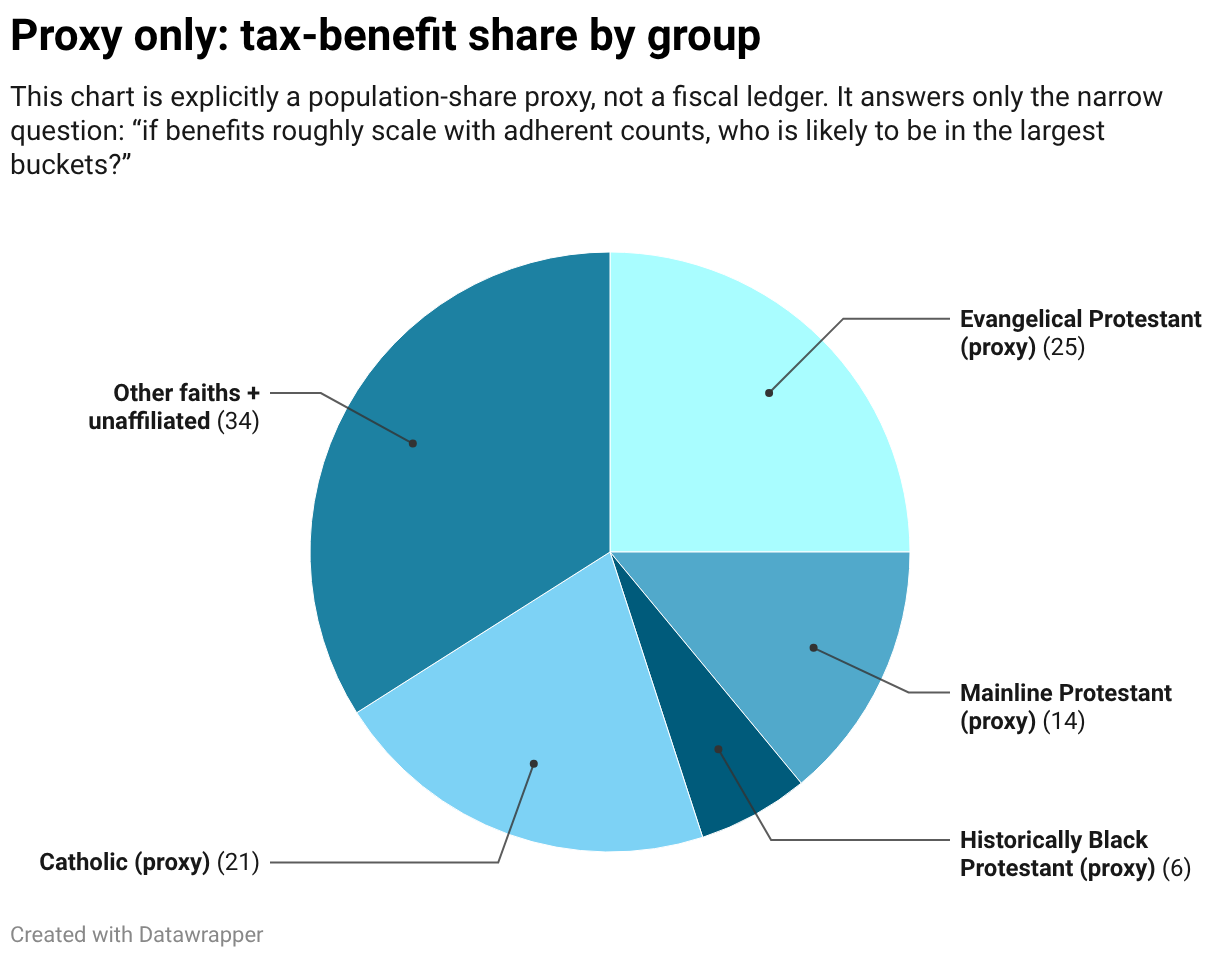
Caution:
- This is a communication tool for readers, not evidence of the true distribution.
- A property-value-weighted model would likely move shares toward groups with larger real estate footprints in high-value metros.
How exemptions can disproportionately benefit some groups and disadvantage others
The tax rules are written to be religion-neutral, but the real-world impact is not distribution-neutral. The biggest mechanisms are structural:
- Property-tax exemption scales with real estate footprint and land value. Traditions with larger property holdings (and especially holdings in high-assessed-value metros) receive larger implicit benefits. Congregations that rent space or share buildings receive far less from this channel.
- The charitable deduction is regressive by design. A deduction is worth more to higher-income donors (higher marginal rates) and to people who itemize. Groups with wealthier donor bases thus tend to receive more subsidized giving.
- Low disclosure can advantage sophisticated, high-scale institutions. When large organizations can operate complex ecosystems (real estate, media, merchandise, affiliates) under lighter standardized disclosure than comparable secular nonprofits, the implicit subsidy can be easier to scale and harder for the public to evaluate.
- Majority status can reduce friction in practice. Even if the law is neutral, zoning fights, community acceptance, and informal scrutiny can make it easier for majority-faith institutions to acquire property and expand, and harder for minority or unpopular faiths to do the same—reducing their access to property-tax-based benefits.
Practical translation for the reader:
- This is not about theology; it’s about wealth + property + institutional capacity.
- The system can be “equal on paper” while still being unequal in who can capture the largest benefits.
What we need to create a stronger “benefit by denomination” graphic
To make this section genuinely evidence-based, we need at least one of these:
- A congregation census dataset with denominational identifiers and (ideally) address/property fields we can map to assessed values.
- A credible, method-transparent estimate in the literature that explicitly allocates property tax exemption or overall tax expenditure by faith group.
If we can get that, we can replace the proxy pie chart with a stronger bar chart: “estimated exempt property-tax value by major tradition (with uncertainty bands).”
8) International comparison: how peers fund religion
The U.S. debate is often framed as “tax churches” versus “do not tax churches.” A more durable framing is conditional exemption: keep core worship activities protected, but require transparency and measurable community benefit at scale.
The United States model is unusual in two ways:
- It provides broad tax exemption and donor deductibility.
- It relies heavily on private donation flows, with less standardized, membership-linked public funding.
Several Western European countries take a different approach: explicit, membership-linked church taxes, often collected alongside income taxes. Those systems make two things clearer than the U.S. approach:
- Who is paying.
- How much.
Germany (Kirchensteuer)
- Church tax is typically 8% to 9% of a person’s income tax liability for members of certain churches.
- Opting out requires leaving the church.
Source: Pew Research Center overview (2019): https://www.pewresearch.org/religion/2019/04/30/in-western-european-countries-with-church-taxes-support-for-the-tradition-remains-strong/
Denmark (Kirkeskat)
- Collected with income tax for members of the Church of Denmark.
- Pew reports that the Church of Denmark received about 6.6 billion Danish kroner in church taxes in 2017, about three-quarters of its revenue.
Source: Pew Research Center overview (2019), “Church tax systems across Europe”: link above.
Implication for the U.S. debate
The U.S. debate is often framed as “tax churches” versus “do not tax churches.” Peer-country systems suggest a more productive framing:
- Make funding explicit rather than implicit.
- Tie benefit to membership choices.
- Reduce reliance on opaque exemptions where the public cannot see proportional community benefit.
9) Policy options
Preferred (most structurally sound)
- Keep worship activity exempt.
- Tax clearly commercial activity like any other business.
- Add tiered transparency requirements tied to revenue and assets.
- Add a community benefit test for large institutions that receive the biggest implicit subsidy.
Other viable options
- Partial exemption above a high revenue threshold.
- Require large churches to file a Form 990-equivalent disclosure.
- Enforce political activity restrictions consistently, with clear rules and penalties.
Conclusion
The strongest case for taxing religious institutions is not cultural. It is institutional.
A system that subsidizes organizations without requiring transparency will predictably attract abuse. A system that tolerates political campaigning while maintaining donation deductibility will distort democratic competition. And a system that treats large, sophisticated institutions like small congregations will be gamed by the largest players.
Religious institutions can be a public good. But tax exemption should be a contract, not a privilege.
Additional reading
TRM (related):
- Religious Institutions Should Pay Taxes (2017 archive)
External:
NPR: IRS filing and candidate-endorsement controversy (July 2025)
IRS: Charities, Churches and Politics (Johnson Amendment baseline and guidance)
OpenSecrets: Clergy & Religious Organizations lobbying sector totals (2024)
USDA ERS: SNAP multiplier research
U.S. Department of Labor: Employer ROI of registered apprenticeship
WHO: Economic case for primary health care
DOJ: House of Prayer fraud indictment (2025)
John Jay College: Nature and Scope report (1950–2002)
Discover more from The Rational Moderate
Subscribe to get the latest posts sent to your email.
